
Yaware.TimeTracker automatically records working time and turns activity data into reports for managers and employees. If you are opening the account for the first time, the number of reports can seem overwhelming. This guide explains where to start and what each main report answers.
The standard reports are available from the Reports menu. They cover time, schedule compliance, employee and group analysis, screenshots and webcam snapshots, and additional analytics.
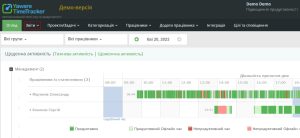
The information comes from employee computers and can show the start and end of the working day, productive and unproductive activity, time away from the computer, and other indicators configured in the account. Use trends and work context when interpreting the data; one chart or one day should not be used as an automatic employee rating.
11 Yaware.TimeTracker reports
1. Overview
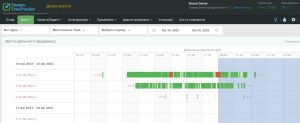
The Overview is the best starting point for a quick comparison of employee activity. The workday timeline shows productive, neutral, and unproductive time as well as periods away from the computer. Hover over a chart segment to view the resources used and their duration.
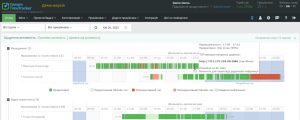
Learn more: Overview report.
2. Activities summary
Open Reports → By time → Activities summary. This report groups employee activity into productive, neutral, and unproductive time. Use the period, department, and employee filters to compare relevant data. If a resource has the wrong productivity status for a role, update its categorization instead of treating the default value as final.
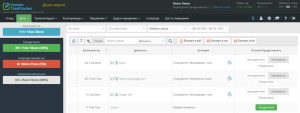
Learn more: Activities summary.
3. Time at the computer
Open Reports → By time → Time at the computer. It shows recorded computer time and helps review when employees began and ended work. Compare it with the assigned schedule and remember that computer time is not the same as completed work or business value.
Learn more: Report by time.
4. Screenshots and webcam snapshots
When these optional features are enabled, the report stores captures with the date, time, and active resource. Use access controls, transparent employee communication, and an appropriate retention policy. Screenshots should support investigation of a specific work context, not replace normal performance management.
Learn more: Managing screenshots and Webcam snapshots.
5. Timesheet
Open Reports → Schedule compliance → Timesheet. It summarizes worked days and hours, absences, leave, sick days, and schedule deviations. Before relying on the report, configure working days, schedules, and the minimum time required for a day to count as worked.
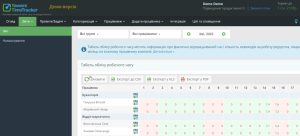
Learn more: Timesheet.
6. Employee and group analysis
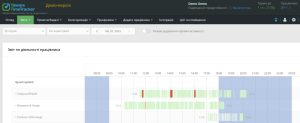
These reports provide a detailed timeline for a selected employee or group. Select a chart segment to see the applications and websites used during that period. Schedule deviations can also appear here when schedules are configured.
You can appoint a group manager under Employees → Group managers. The manager sees only assigned groups, while the account owner retains broader access.
Learn more: Employee activity analysis and Group analysis.
7. Real-time activities
The real-time report shows the latest available activity status. It is useful for an operational overview, but should not be treated as proof that a person is or is not working at a particular second. Network delays, offline work, breaks, and synchronization can affect the latest status.
Learn more: Real-time activities.
8. Applications used
Open Reports → Additional reports → Applications used. The report ranks websites and applications by recorded time. Filter it by employee, group, or period, then review the productivity category in the context of each employee’s responsibilities.
Learn more: Activities by application.
9. Offline activity
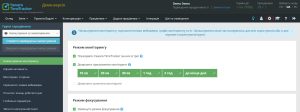
Offline activity explains time away from the computer, such as meetings, calls, lunch, breaks, or client visits. Configure the available offline activities and, if appropriate, ask employees to select a reason when they return.
Learn more: Offline activity.
10. Schedule compliance
Schedule-compliance reports help review late starts, early finishes, and work outside the assigned schedule. Configure the schedule first, then discuss repeated deviations with the employee and consider role, flexible hours, time zone, and approved exceptions.
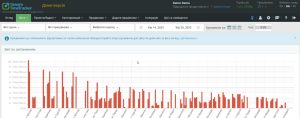
Related reports: Latecomers, Left before time, and Work outside scheduled hours.
11. Employee ratings
Employee ratings compare recorded productive or unproductive time for the selected period. Filter by team, employee, and date. Treat the rating as a navigation and diagnostic tool: productivity categories, job responsibilities, results, and data completeness must be checked before drawing conclusions.
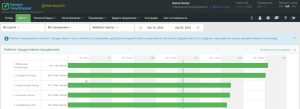
Learn more: Productive employee rating and Unproductive employee rating.
How to use the reports together
Start with the Overview, then open a detailed report only when a trend needs explanation. Compare time with schedules, tasks, outcomes, and employee context. Give employees access to their own statistics where appropriate and delegate group analysis through role-based manager access.
To evaluate Yaware.TimeTracker for your organization, review the available plans.