Using this report you can analyze the performance of each department by looking at simple comprehensible graphs.
The report consists of four reports that allow give all necessary information about department’s performance during a selected period of time.
1. Log in to your Yaware.TimeTracker account: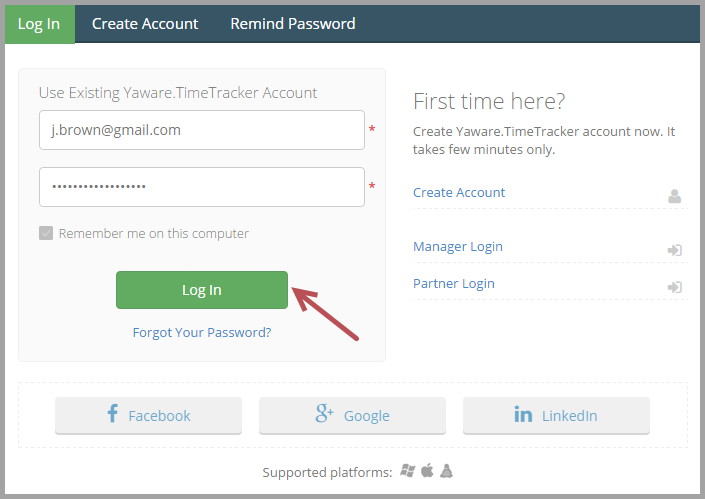
2. Go to Reports – Activities – By group: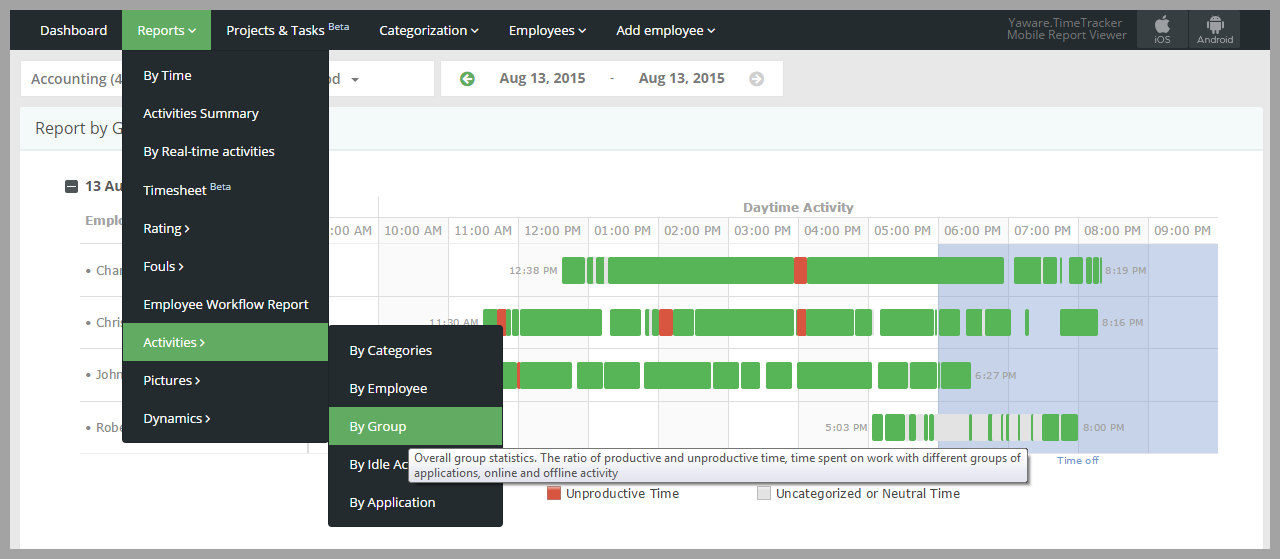
3. Click on the filter to choose the group: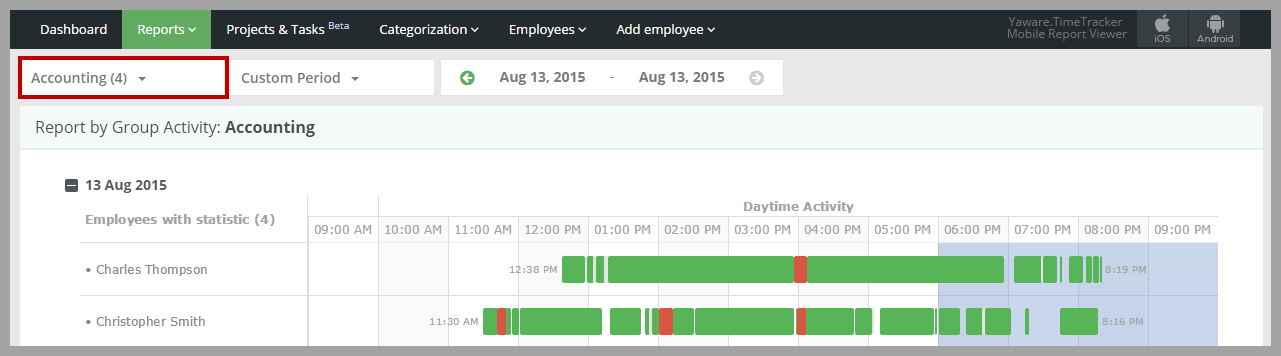
You can only choose one group for analysis: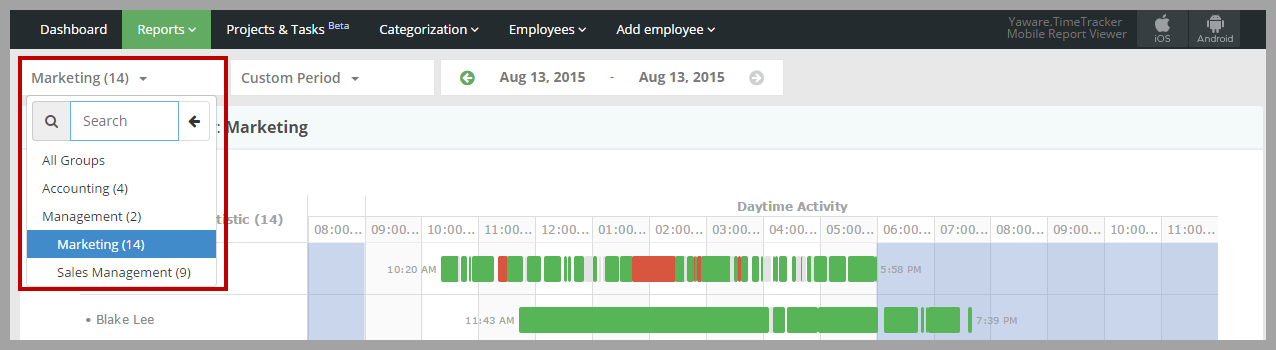
4. Next, choose the period for which you want the data to be displayed by clicking on a corresponding filter: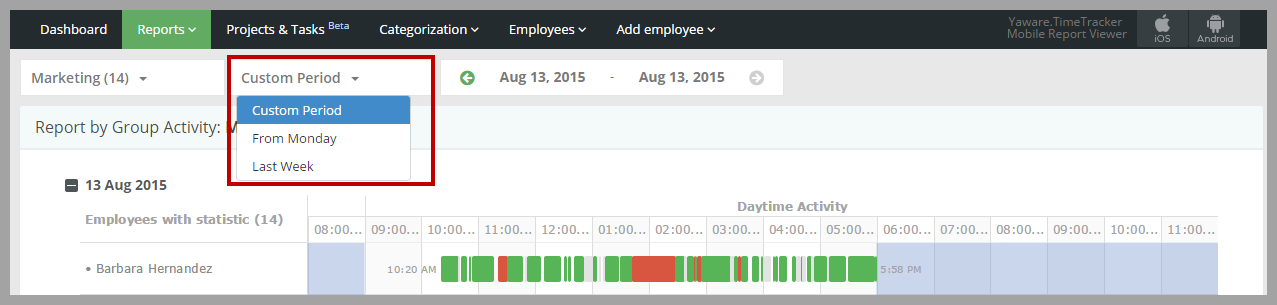
Or chose the period from the calendar: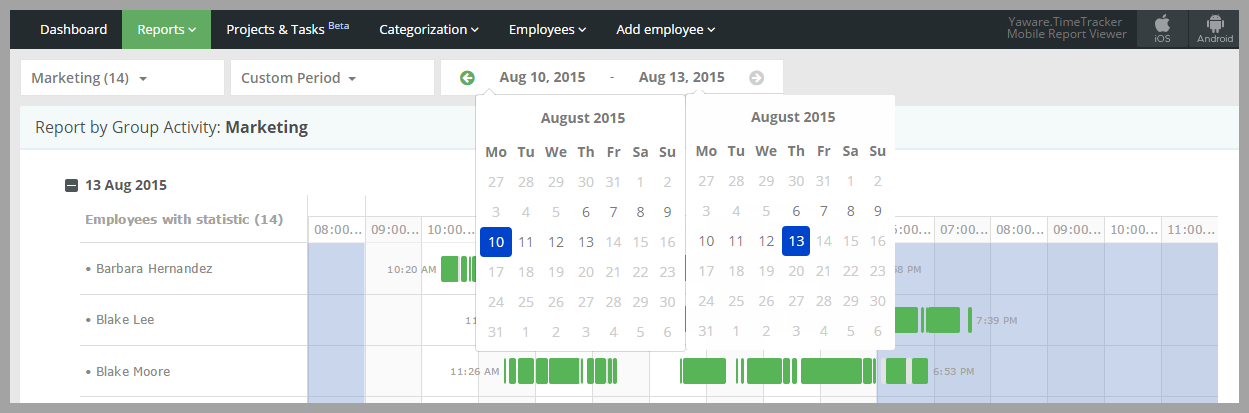
5. Now that the settings are done, it’s time to analyze the reports.
The first report shows general activities of the group. Here you can see employees’ start and stop time, they productivity depiction and periods of absence (gaps between the activities):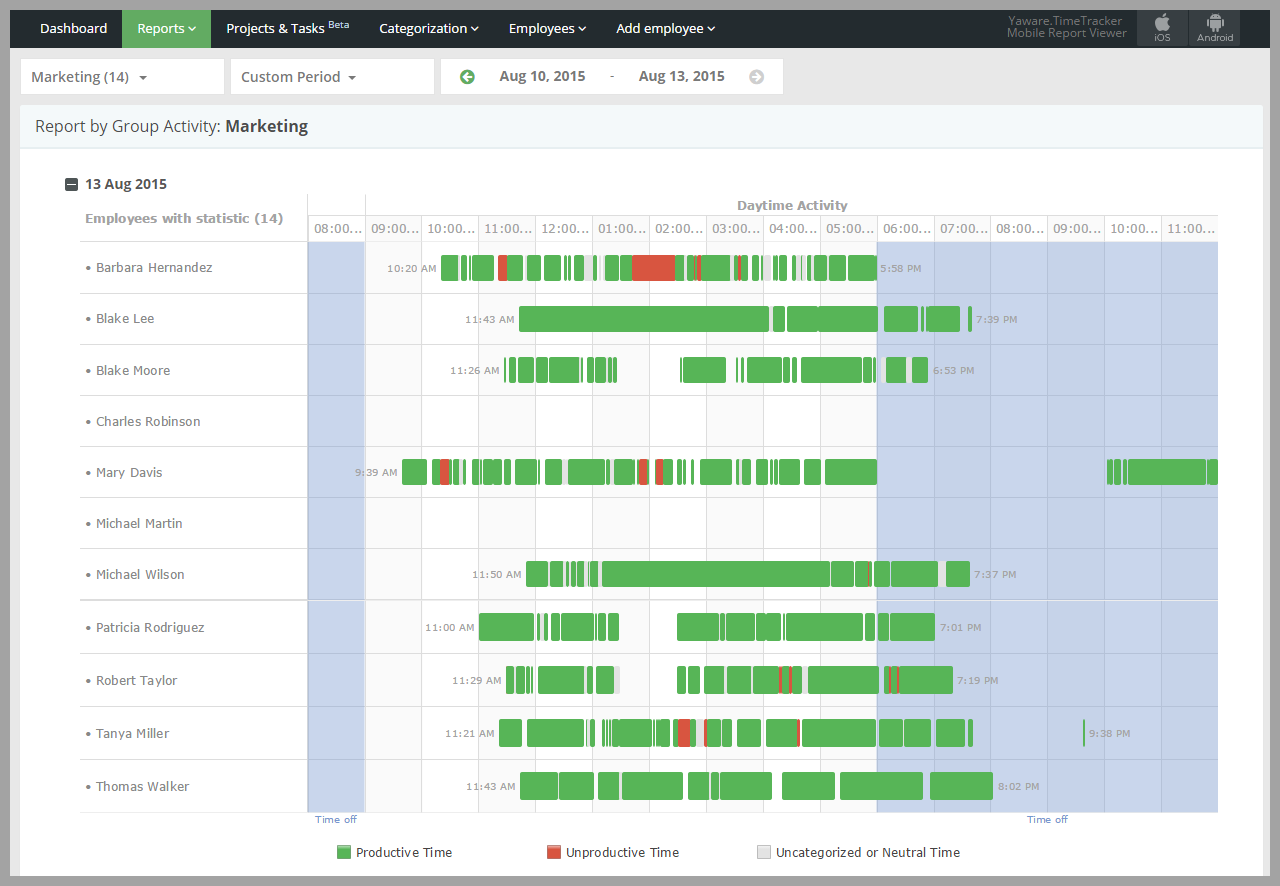
If you point the cursor to the chart you will see the list of websites and applications that employee has been using during a selected time period: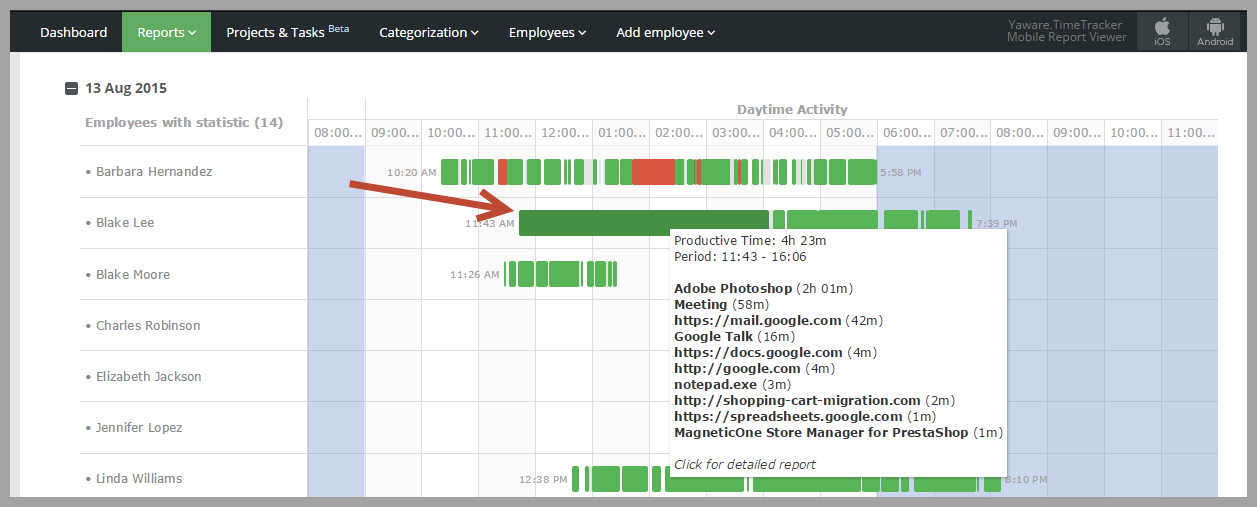
The next report shows the structure of group’s time in pie and column chart: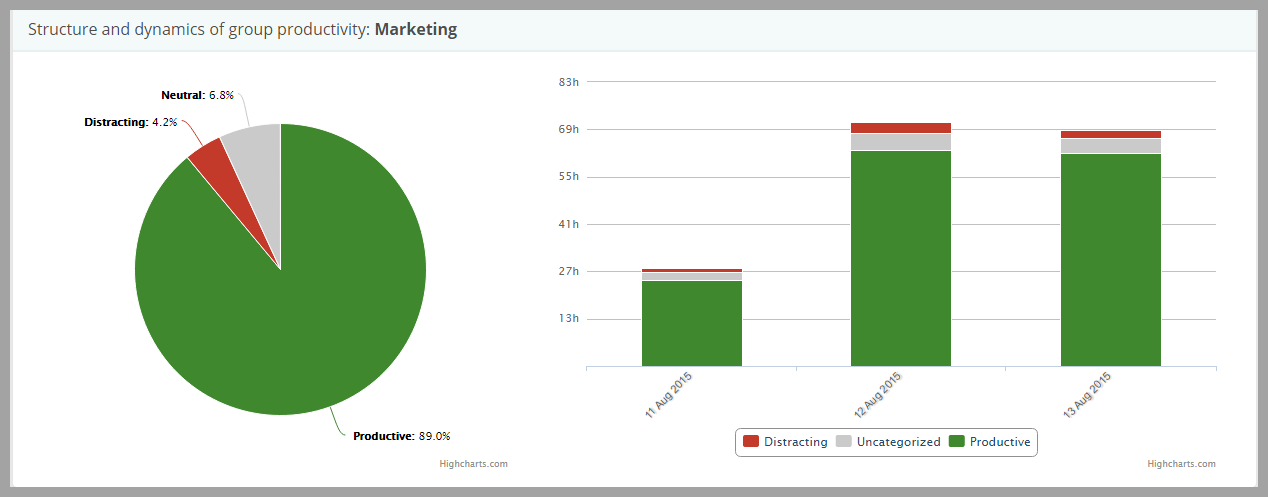
By checking this report you can quickly find out how much time the group spent productively, unproductively and neutrally.
The third report shows which categories of resources are used, which are used more or less: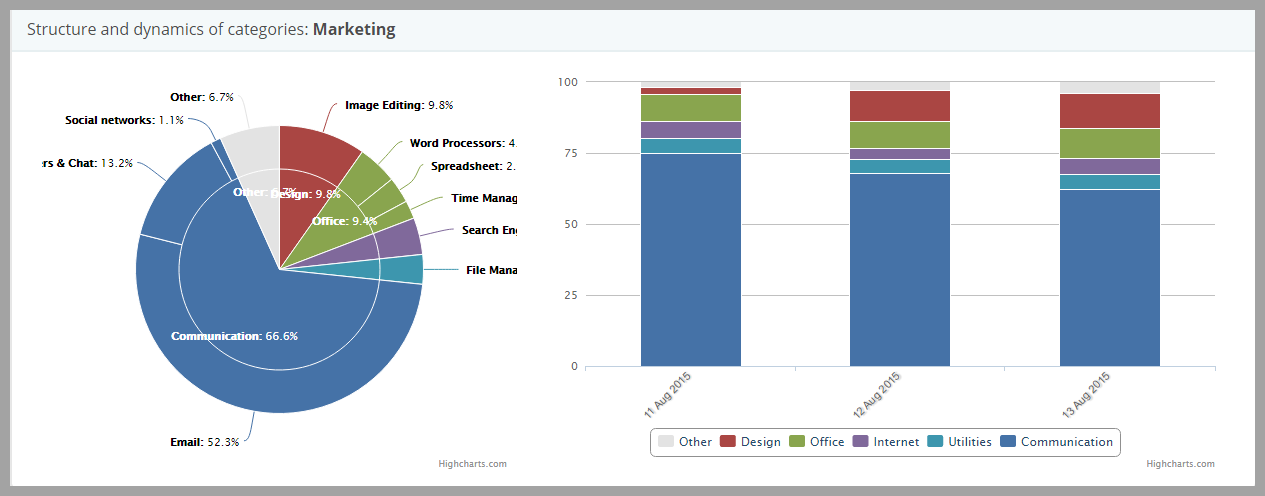
If you point to any part of the pie chart, you will see the total use time of a selected category. E.g. on the screenshot you see that Marketing has been using the communication resources for 75 h 26m: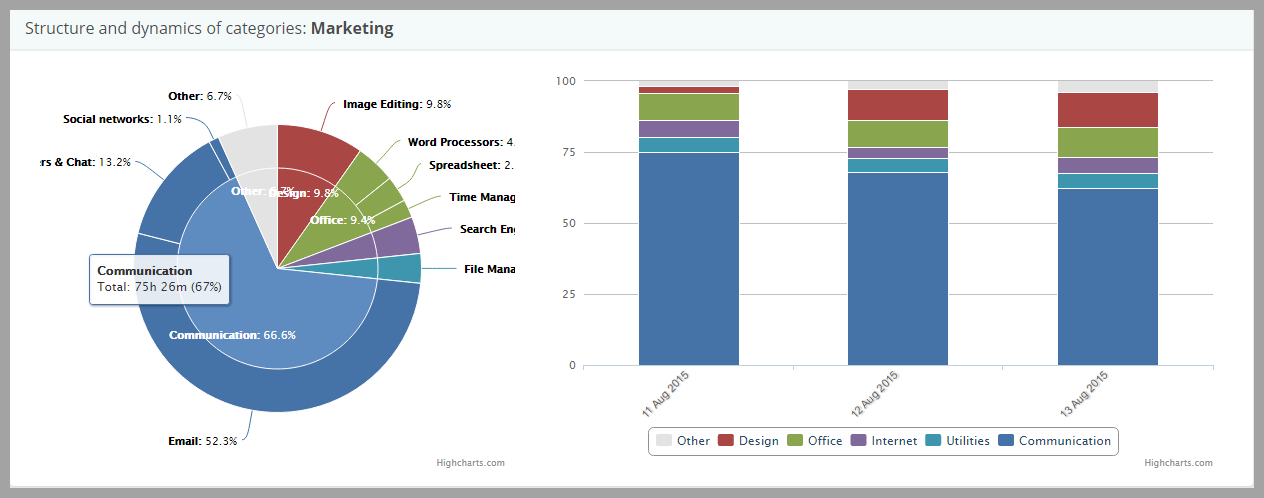
The last report sums up the online (at the computer) and offline (away from the computer) time in a simple chart:
That’s it! Now you know how to quickly and easily analyze the time and productivity of your departments using Yaware.TimeTracker.