
Date Activity Graph
The graph shows the user’s current activity. Here you can verify:
Who and when started / finished the working day:

What user activity was dominated during the working day:
Which plugins were used over a period of working day: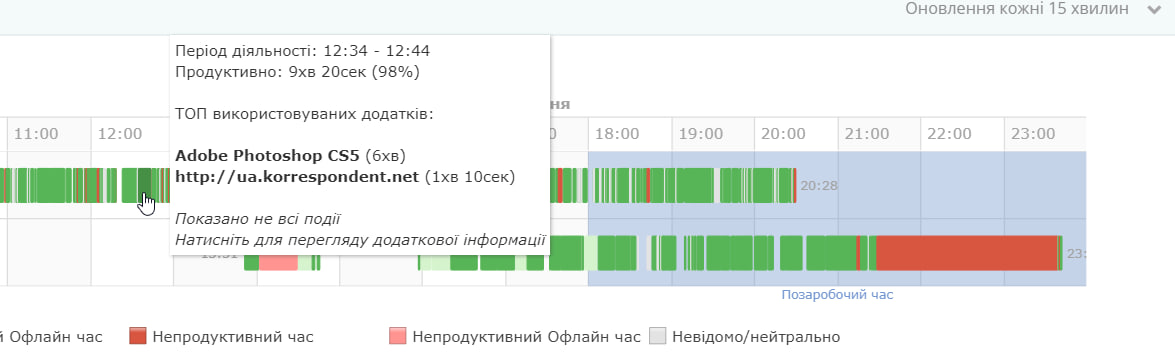
Click on some part of the diagram to get more information.
Diagrams are displayed in groups and user names in alphabetical order.
Dayactivity Summary
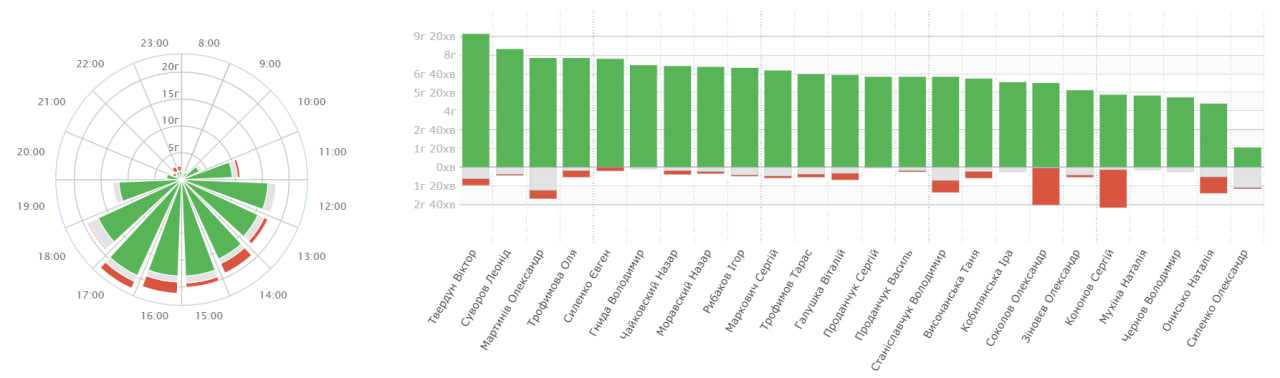
This graph shows the ratio of productive, neutral and unproductive time per day. The activity is summarized with plugins used. Users are percentage over the amount of effective time they’ve worked.
On the user profile you can see how long the user spent on certain tasks. Look at the percentage of this time relative to the total time.
If the chart has a higher gray color, you need to define categories for these plugins, or change productivity by default for these plugins. This can be done in a tab. “Categories“.
Configuring a filter by user and date
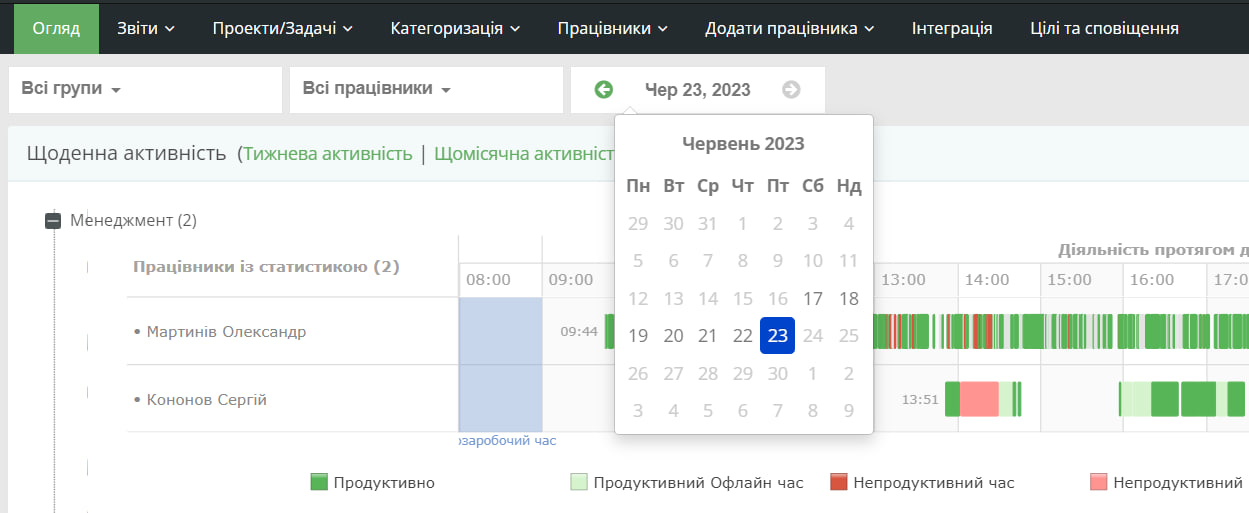 By selecting the Monitor Panel, all users are currently displayed. You can filter data to see information about one user or select another date.
If you do not have a group of users, the user filter will be hidden.