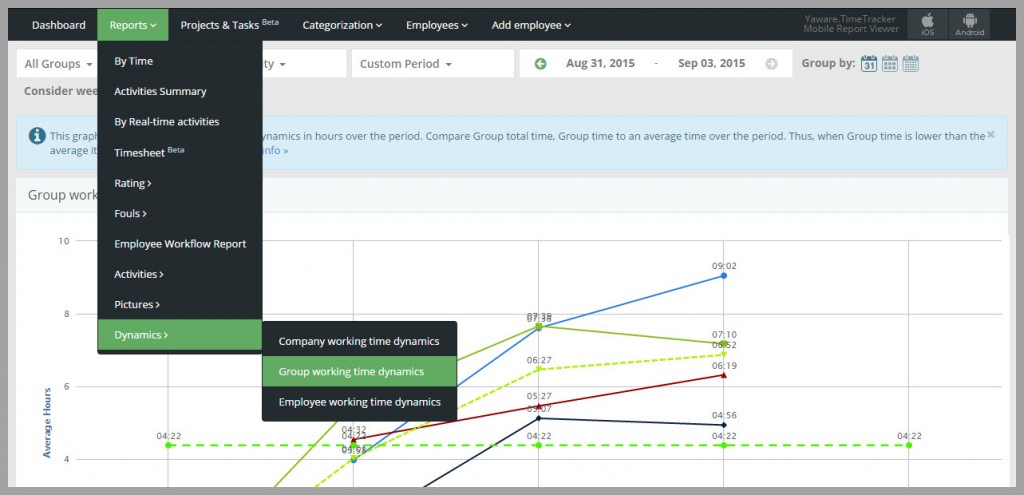
The report allows to compare the performance of departments during a specific time period.
1. Log into your Yaware.TimeTracker account: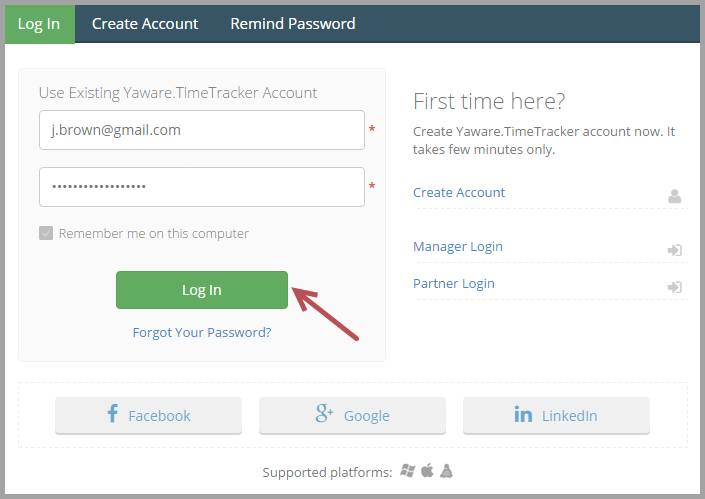
2. Click “Reports” – “Dynamics”. Select the report “Group working time dynamics”:
3. Click the “All groups” filter to choose the department whose data you want to see:
Now choose the period for which you want to see the dynamics. You can either specify it in the filter or choose the custom date in the calendar:
If you have employees who work on weekends, check the “Consider weekends for average” to include the weekends into dynamics:
You can also compare how productive, unproductive and neutral time changes during the selected time period. For that, click on the “All Productivity filter”:
This is what the customized report looks like: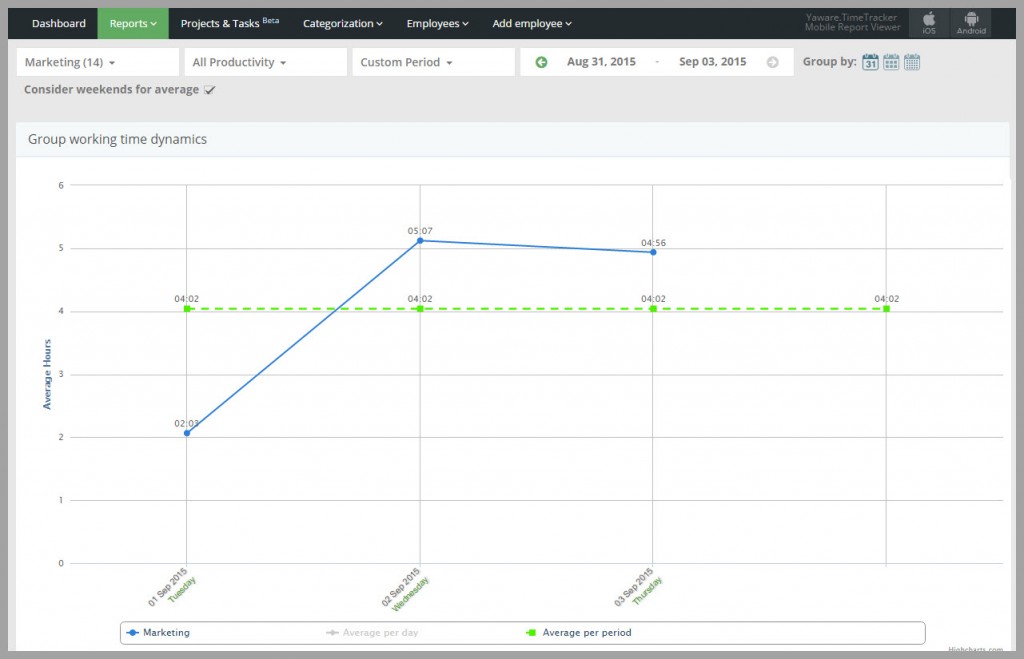
If you choose several departments for comparison, each department will be marked with a color for easier understanding: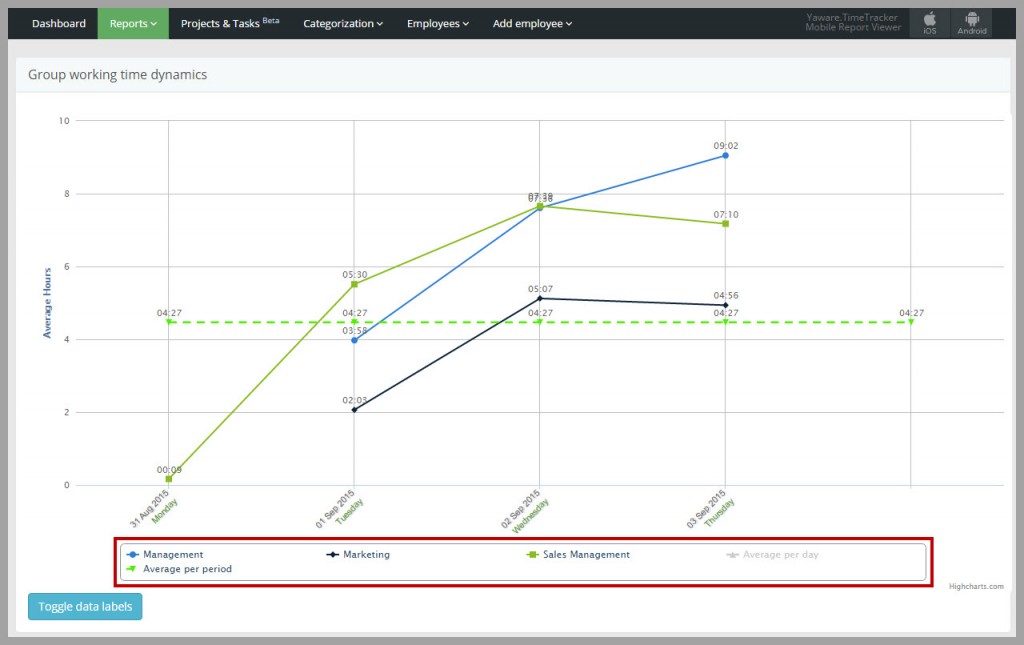
If necessary, you can toggle the time labels. You can still see total worked time for a specific day by pointing at it: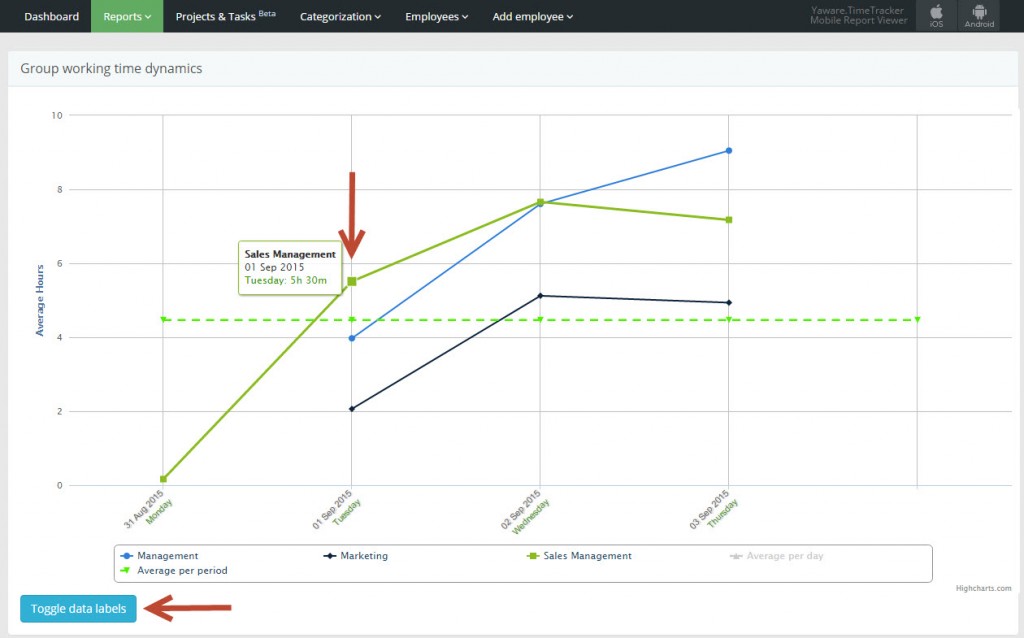
The report also contains the following dynamics: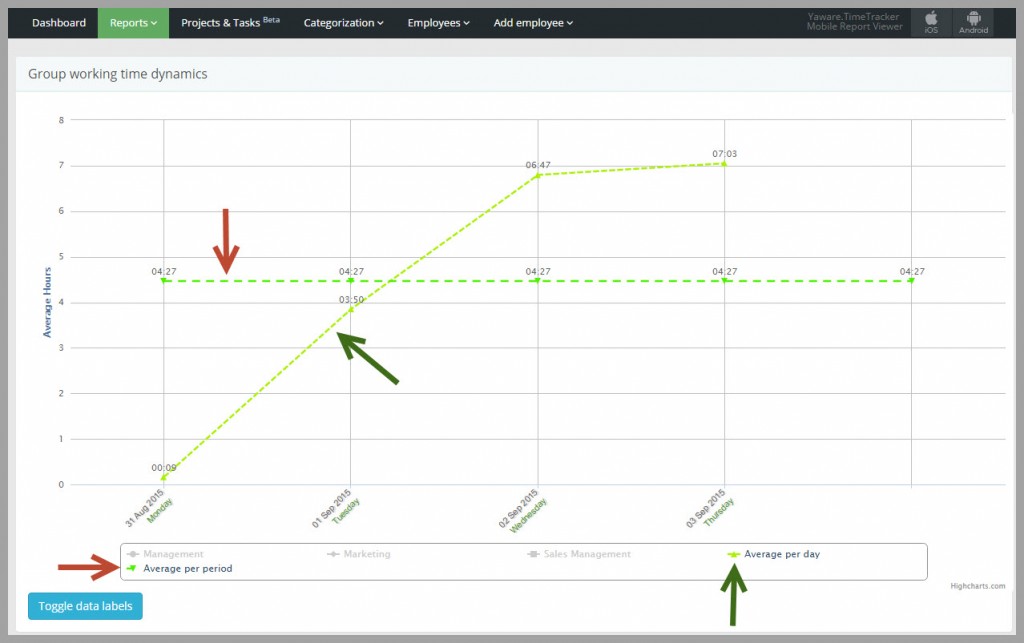
The Average per period dynamic shows the average time worked during a selected period.
The Average per day dynamics shows the average time worked on each day of a selected period.
That’s it! Now you can analyze the dynamic of departments’ time quickly and effortlessly!
