
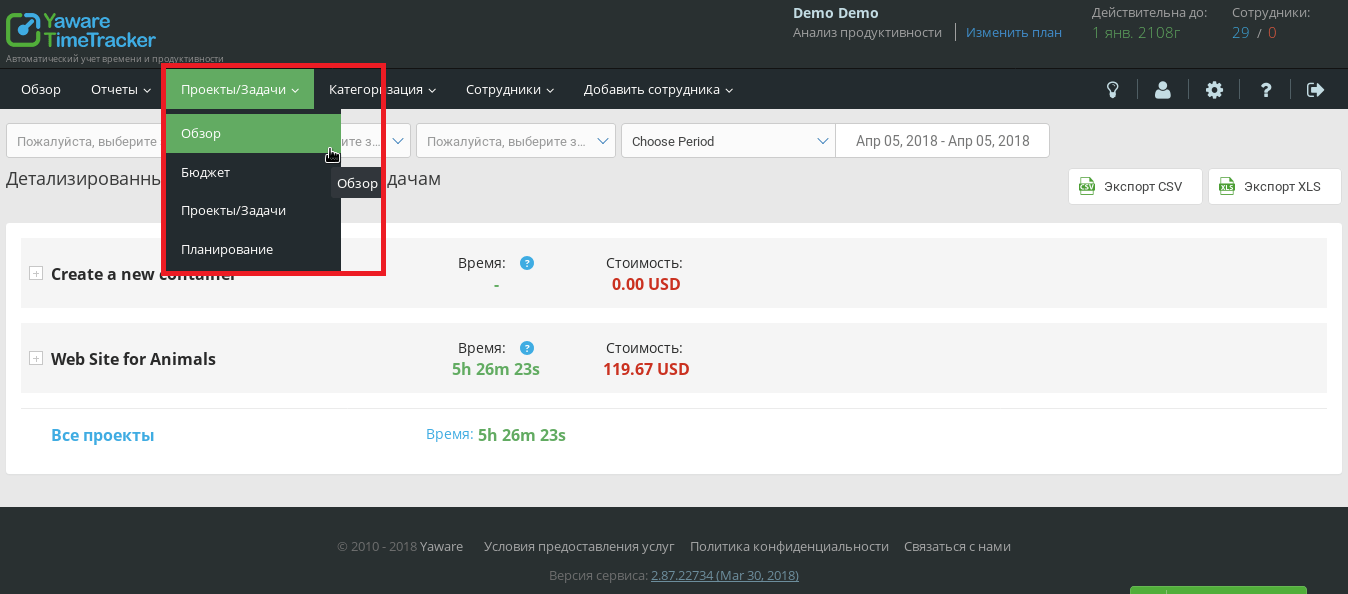
In the Projects / Tasks > Overview menu, you can see the statistics of the applications used during the execution of each task.
Then expand the project to see all tasks and detailed statistics on their completion.
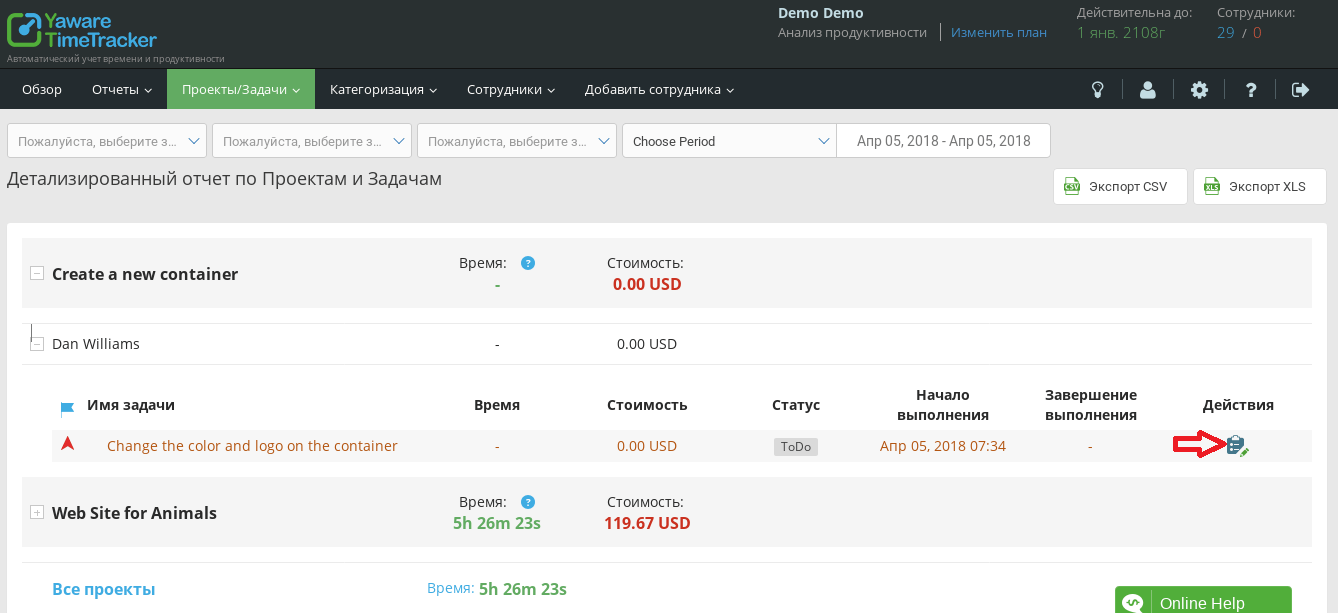
 In the row of the desired task, click the “Edit task” action icon, then the task edit window will open.
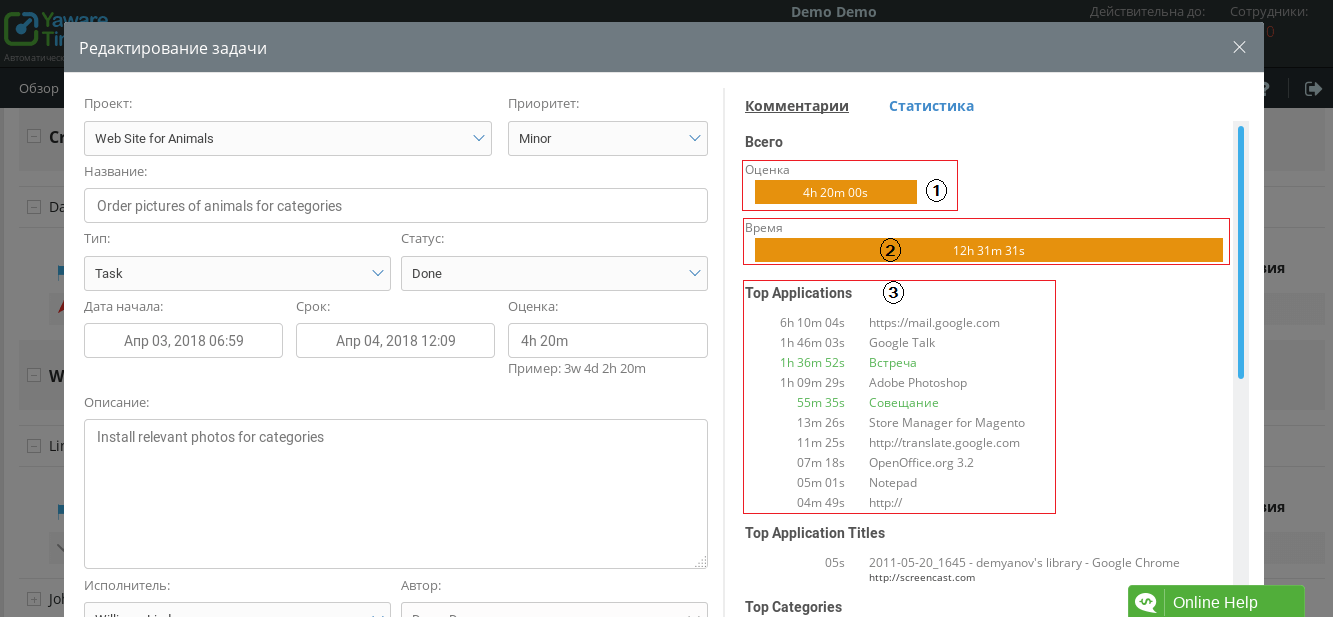
The left part of the editing window allows you to change the parameters of the task — name, priority, and others. Comments and usage statistics will be displayed on the right side of the editing window. Click on statistics.
The overall score shows the previous deadlines for completing the task (1), and the time graph shows the actual time spent (2). Top Applications (Top Applications) shows the usage time of all applications in descending order (3).
 The top categories diagram (Top Categories) distributes used applications by types (4). The diagram (Top Productivity) reflects the productivity of the used applications (5). If the task executor used inappropriate applications, this will be marked in red on the diagram.
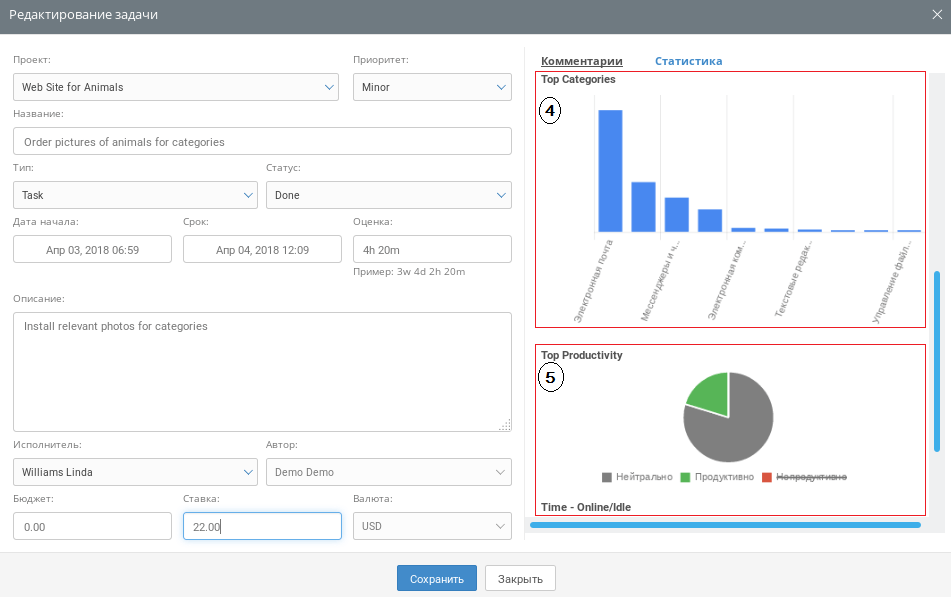 The last chart Time — Online / Idle shows the ratio of online and offline activity.
 Hover your mouse over a column or sector of the chart to see the usage time of the corresponding apps.