This tab contains two charts characterising daytime activities.
Daytime activity chart
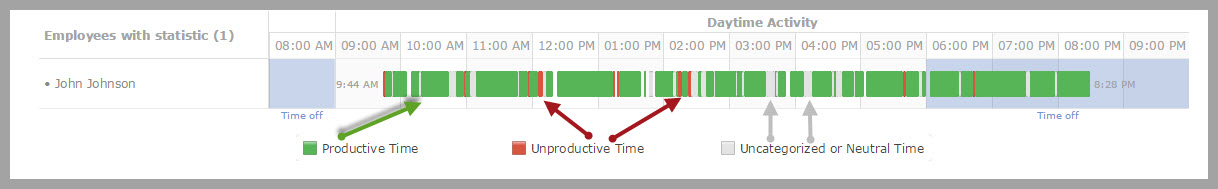
The chart shows user’s daytime activities. Here you can check:
Who and when has started/finished the working day
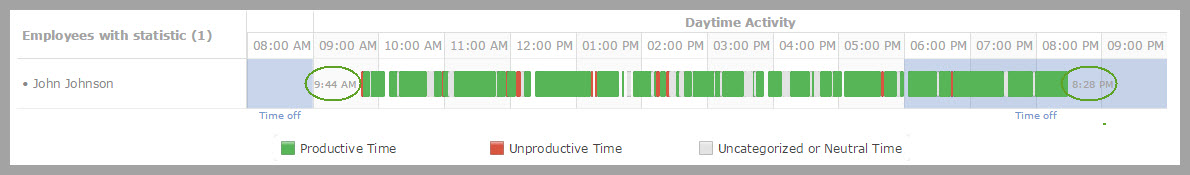
What kind of user activity prevailed during the working day
What applications were used during a certain period of the working day
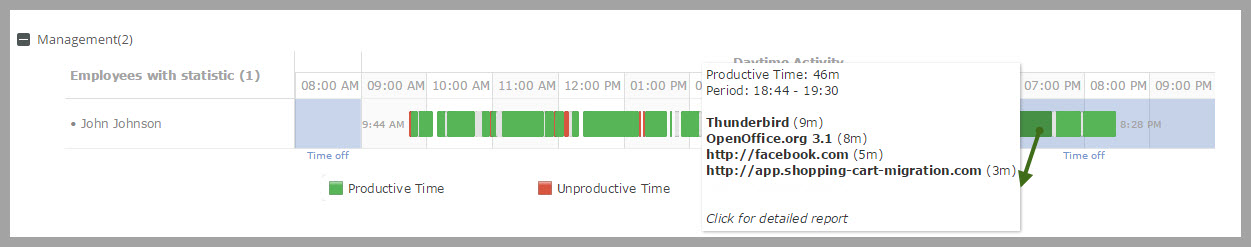
Click on a certain section of the chart to get more information.
Charts are displayed by Groups and user names in an alphabetical order.
Daytime activity summary
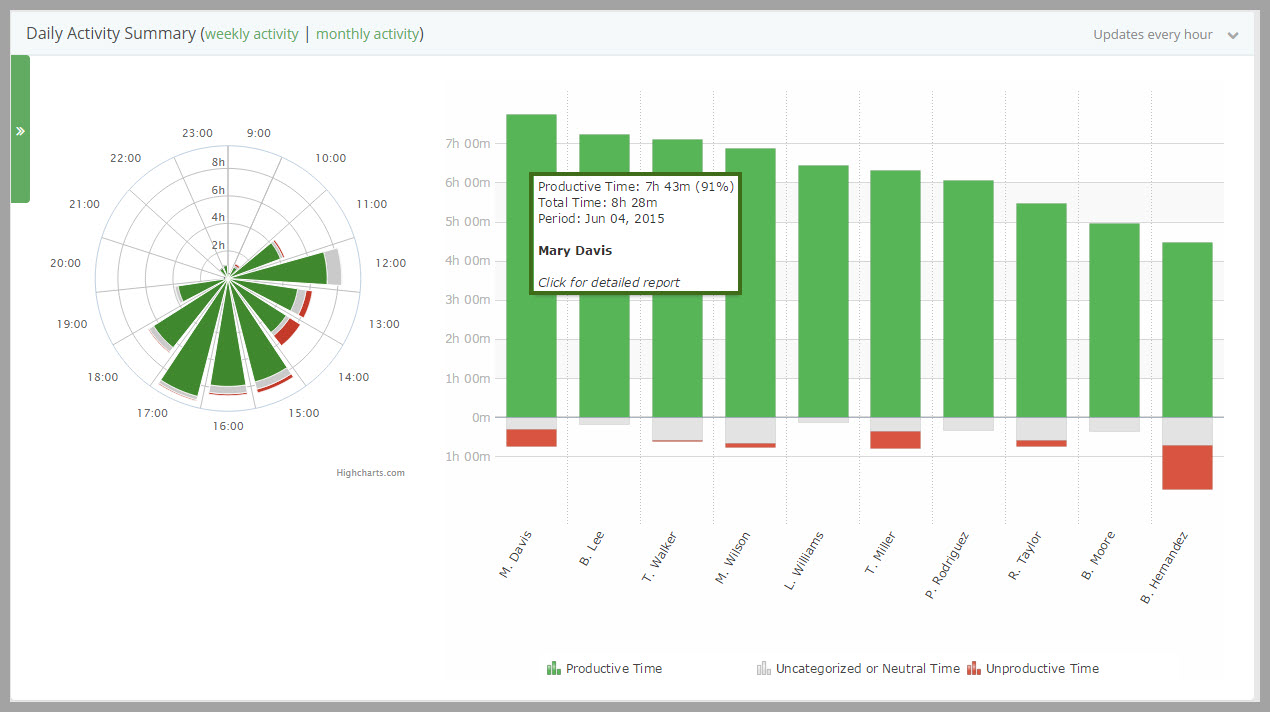
This chart shows the ratio of productive, neutral and unproductive time during the day. The activity is summed up, taking into consideration the applications used. Users are sorted by the amount of efficient time they had worked.
When you point to the user profile, you can see how much time the user spent performing certain tasks. Look at the percentage of this time in relation to the total time.
If the chart shows grey color mostly (uncategorized applications), you should define the categories for the applications, or change default productivity for these applications. You can do that in “Categories” tab.
Setting the filter by user and date
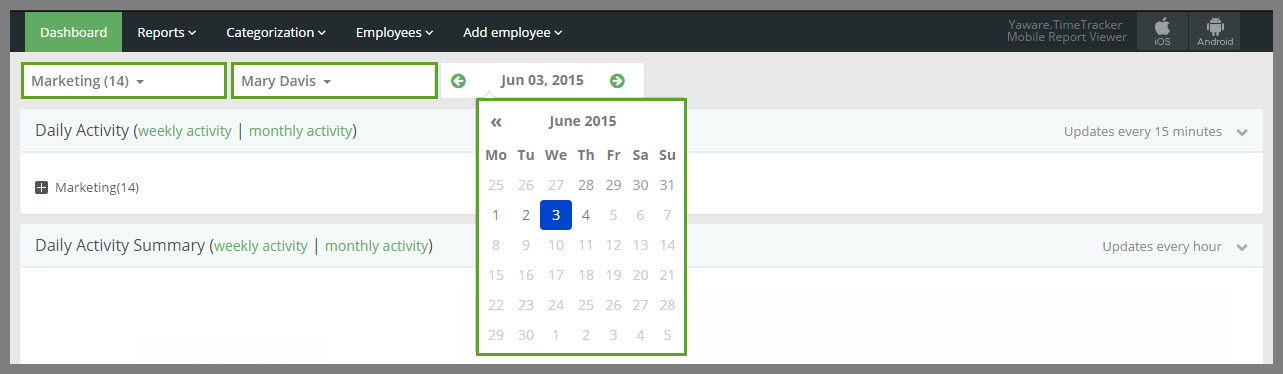
By default, the Dashboard shows the data by all users on the current date. You can filter data so that you can see information about one user or choose different date.
If you do not have user groups, filter by users would be hidden.