This report shows the most commonly used applications grouped by categories and according to the duration of their use.
There are 11 basic categories:
- Business (contains 138 apps and websites, productive by default).
- Communication (contains 359 apps and websites, neutral by default).
- Design (contains 127 apps and websites, productive by default).
- Development (contains 172 apps and websites, productive by default).
- Games & Entertainment (contains 265 apps and websites, neutral by default).
- Internet (contains 263 apps and websites, neutral by default).
- Job search sites (contains 246 apps and websites, distracting by default).
- Multimedia (contains 164 apps and websites, distracting by default).
- News & Learning (contains 200 apps and websites, neutral by default).
- Office (contains 182 apps and websites, neutral by default).
- Utilities (contains 589 apps and websites, neutral by default).
If you would like to learn more about categorization of resources, please click here.
1. Login to your Yaware.TimeTracker account: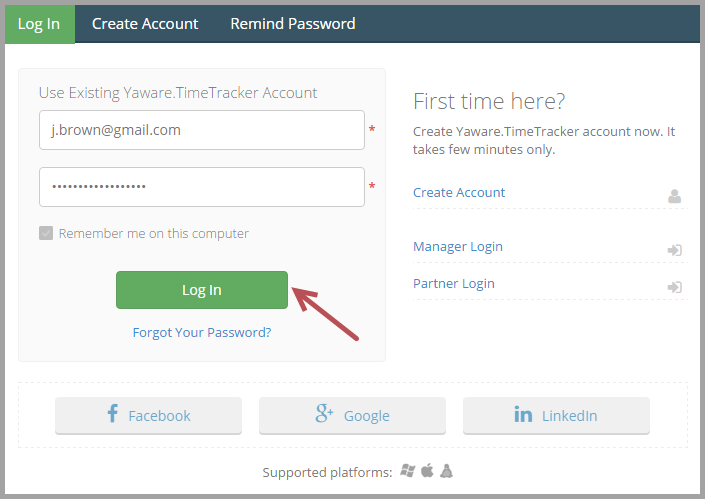
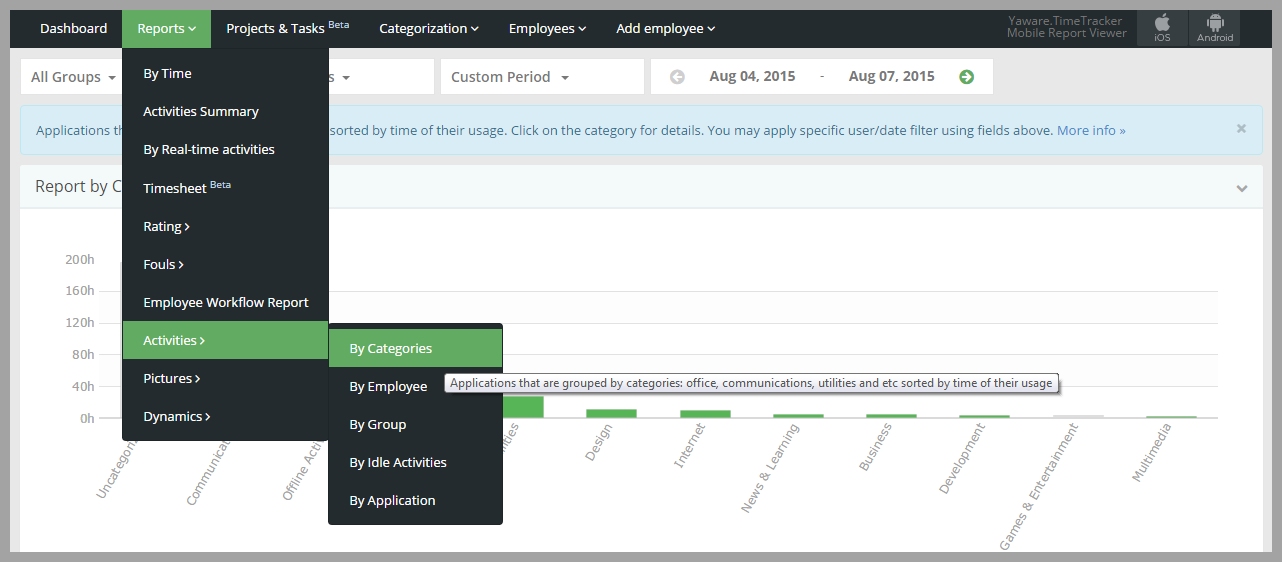
2. Go to Reports – Activities – By categories:
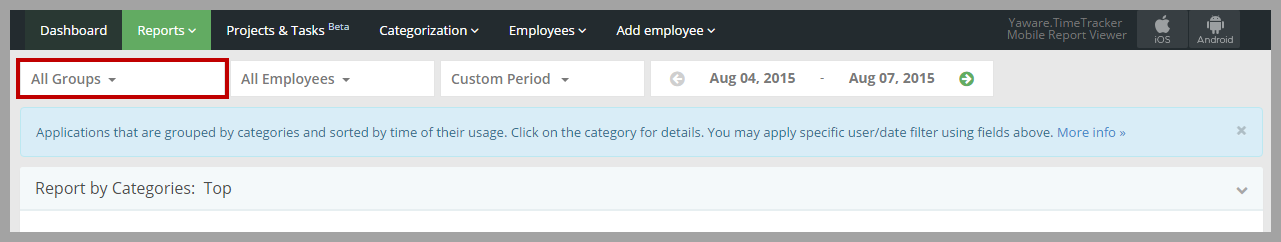
3. Click on “All groups” filter to choose the department for which you want the data to be displayed:
You can choose one or several departments: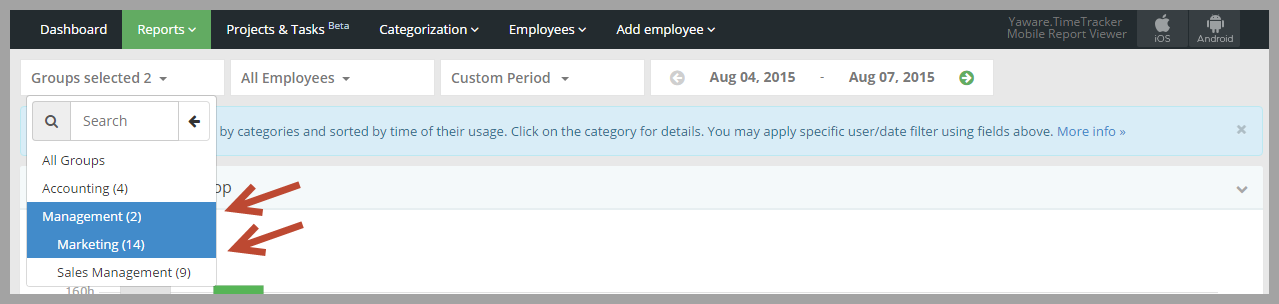
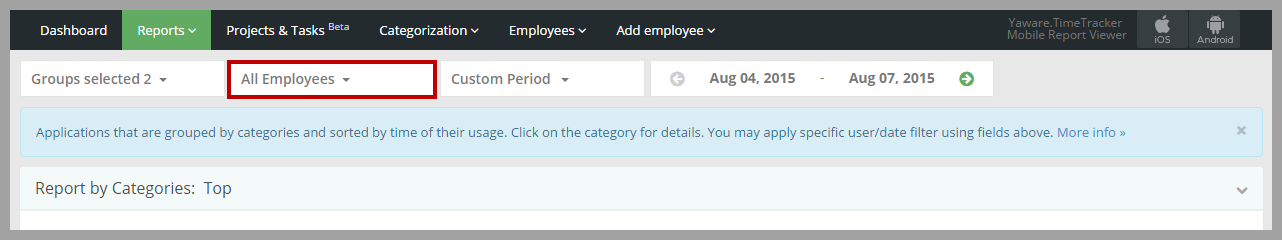
4. Next click on “All employees filter” to choose employee/s whose statistics you want to view:
You can analyze the statistic of a single employee or several employees at a time. Just click on employees to see their statistic: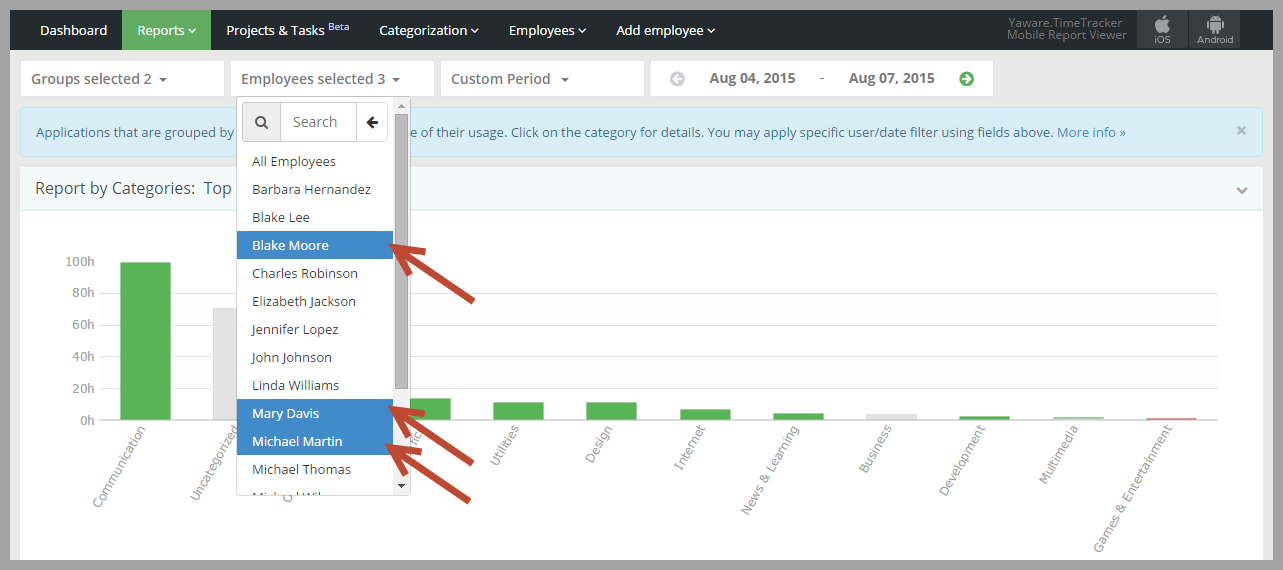
5. Click on Custom period menu to specify the period for which you want the data to be displayed and choose the appropriate option:
You can also specify the date by choosing it from the calendar: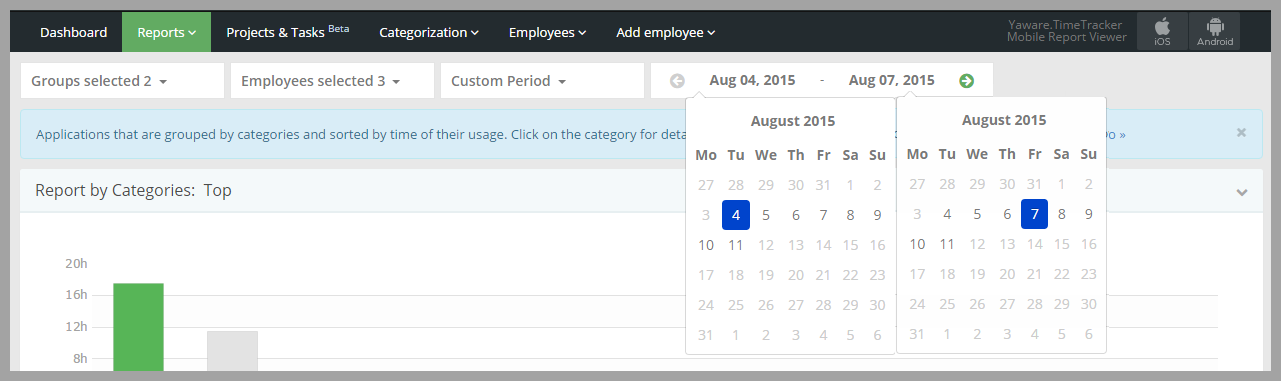
6. You have successfully customized the report. Now it’s time to analyze the data.
Point to the chart to see the total use time of a certain category. In this case we see that these 3 particular employees have been using the Communication category for 17 h 22 m, and this category is productive. So, their working time is productive as well: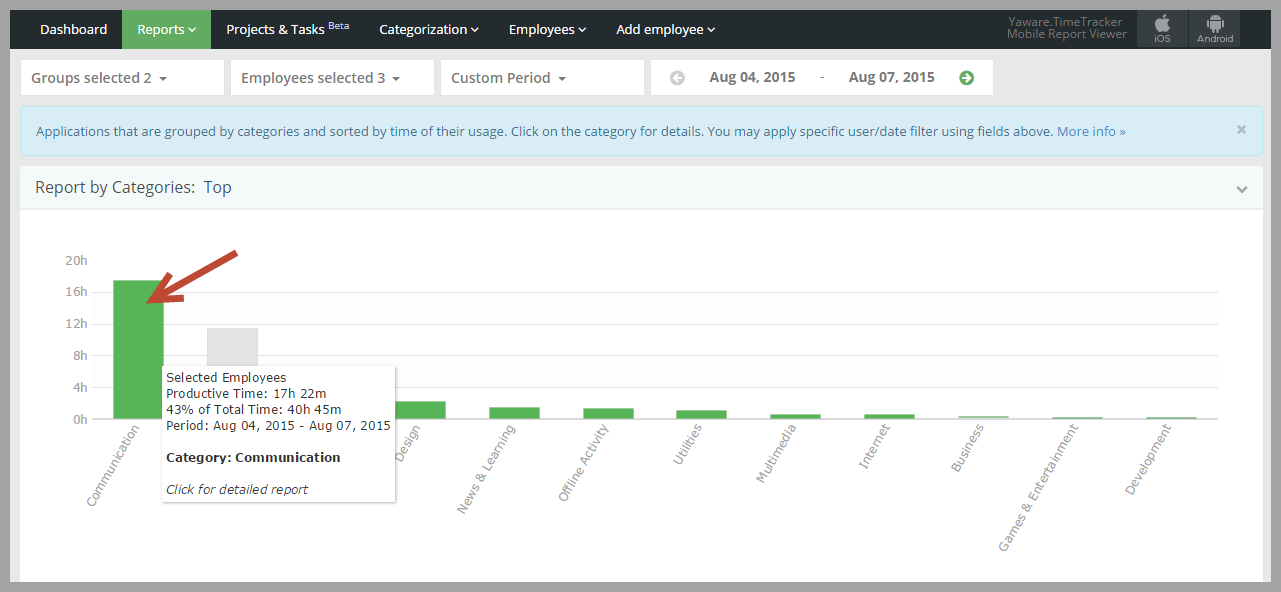
Scroll down to see which apps and websites are used the most, as well as the duration of use: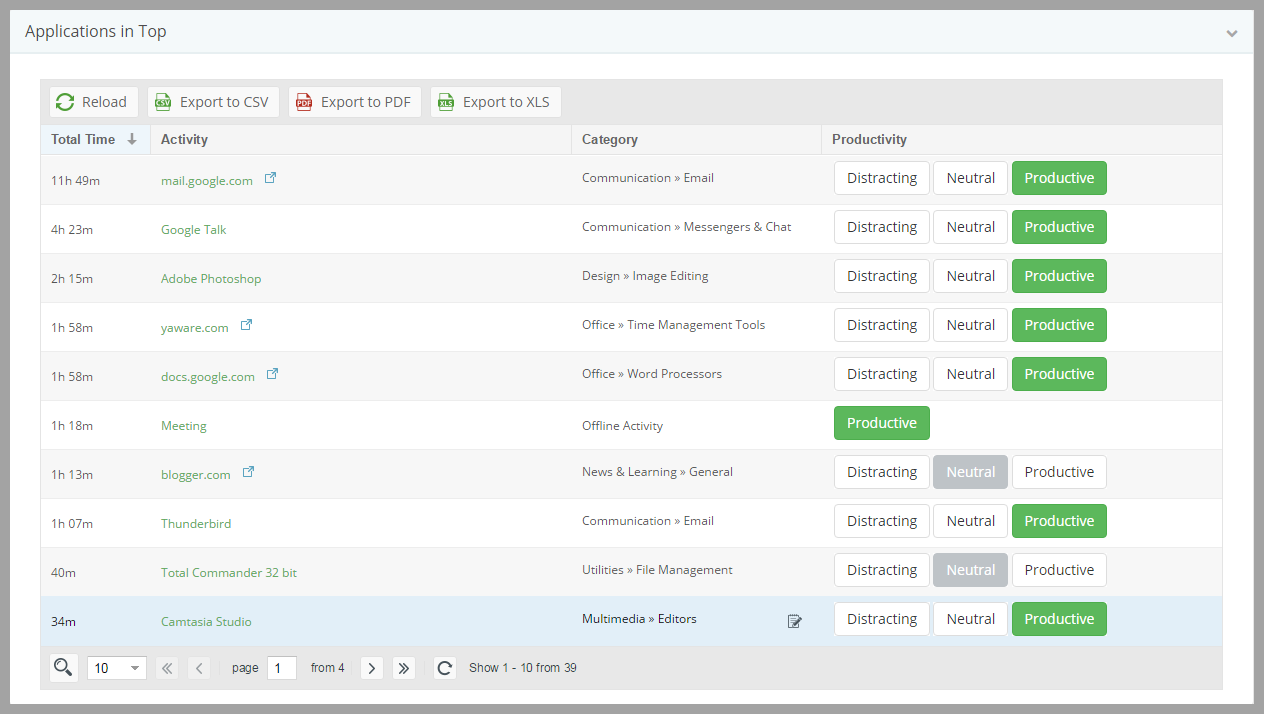
Here you can also change the productivity of a certain app/website. E.g., you can make Gmail unproductive. To do so, click on “Distracting” button: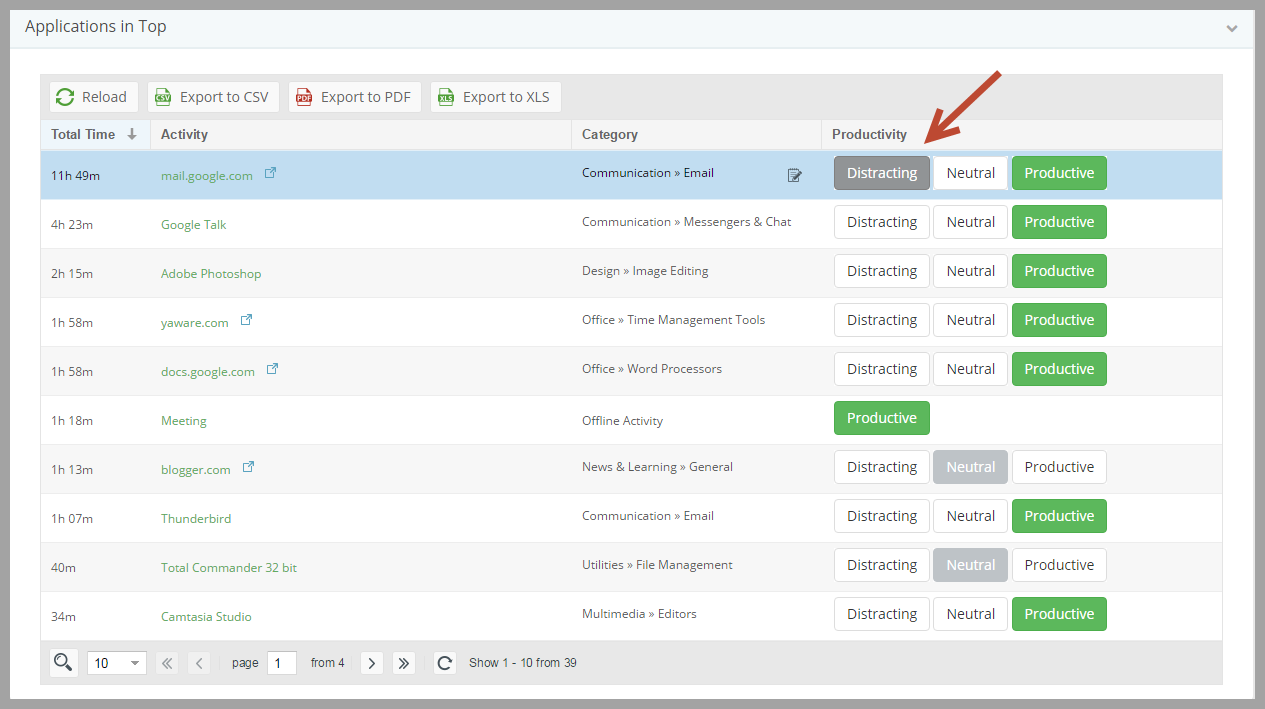
You will then see the following window, where you can specify if you want to make Gmail unproductive for all groups or employees, or choose a specific group and employee: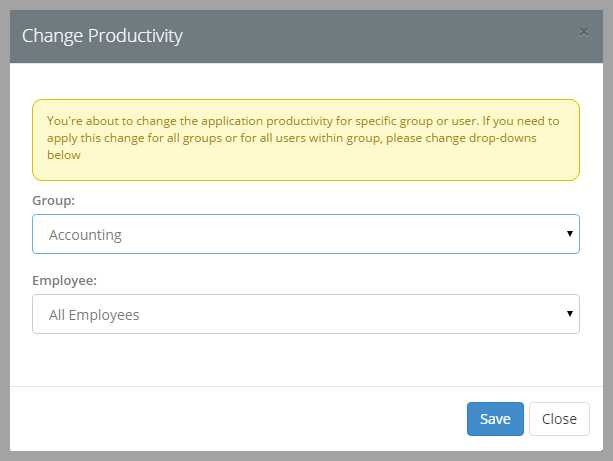
You can also change the group to which a certain app.website belongs. Just click on a corresponding icon: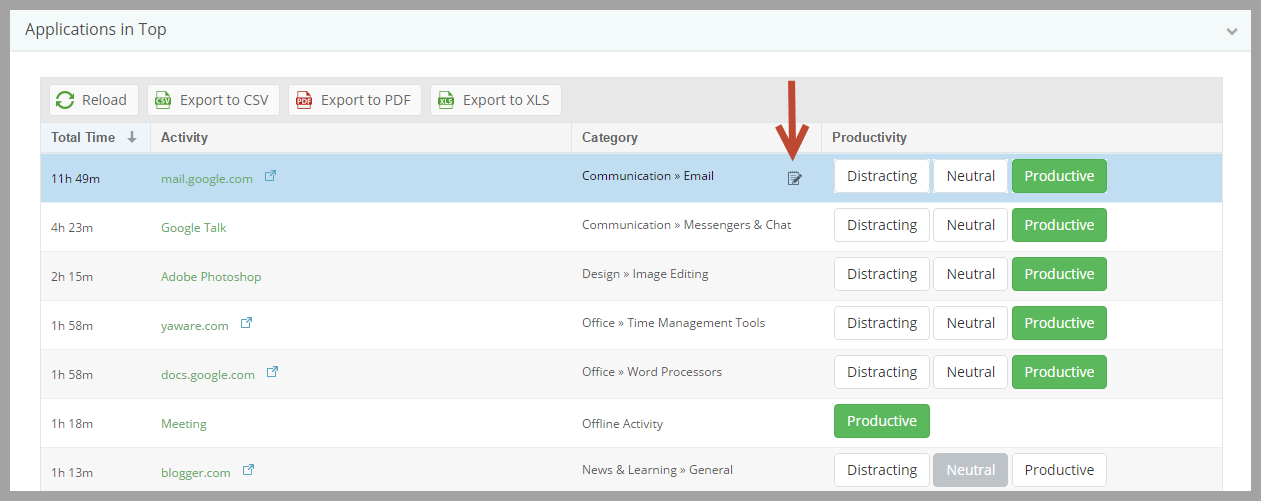
And choose the category to which you want to move the app/website: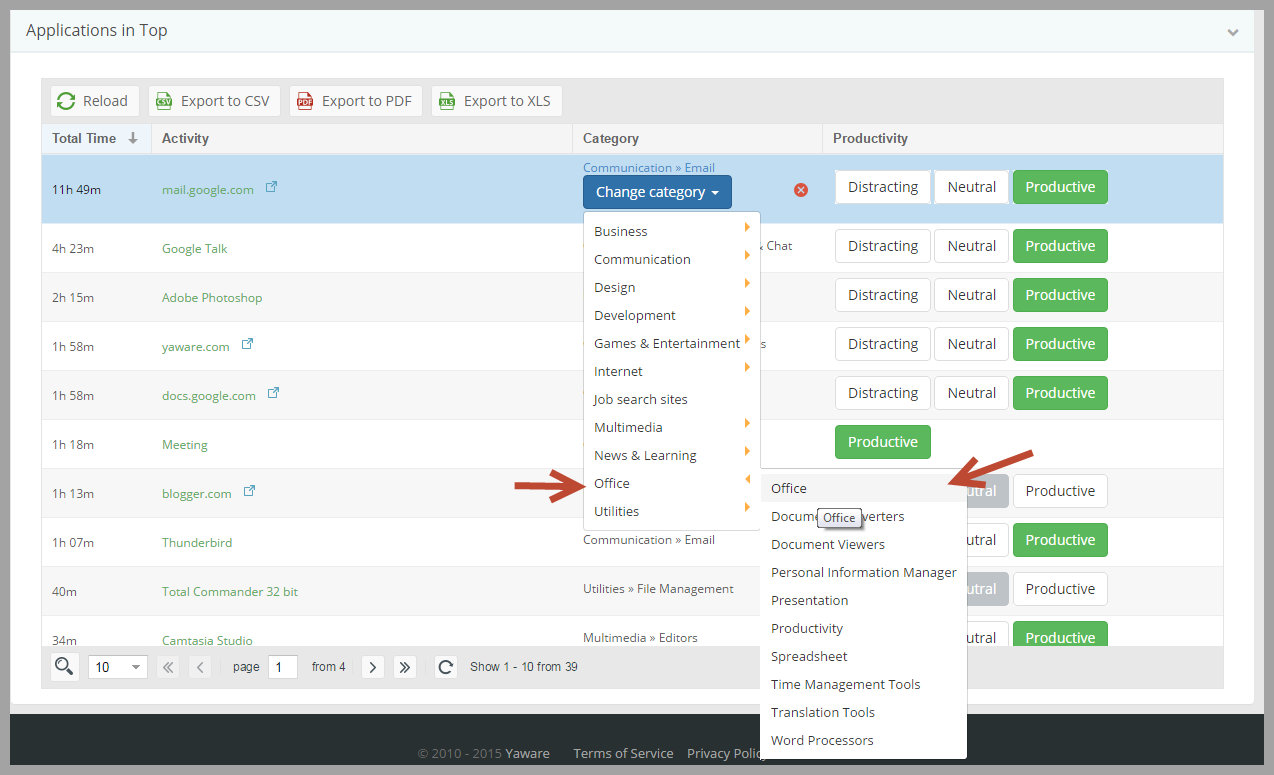
If necessary, you can export this report to CSV, PDF and Excel: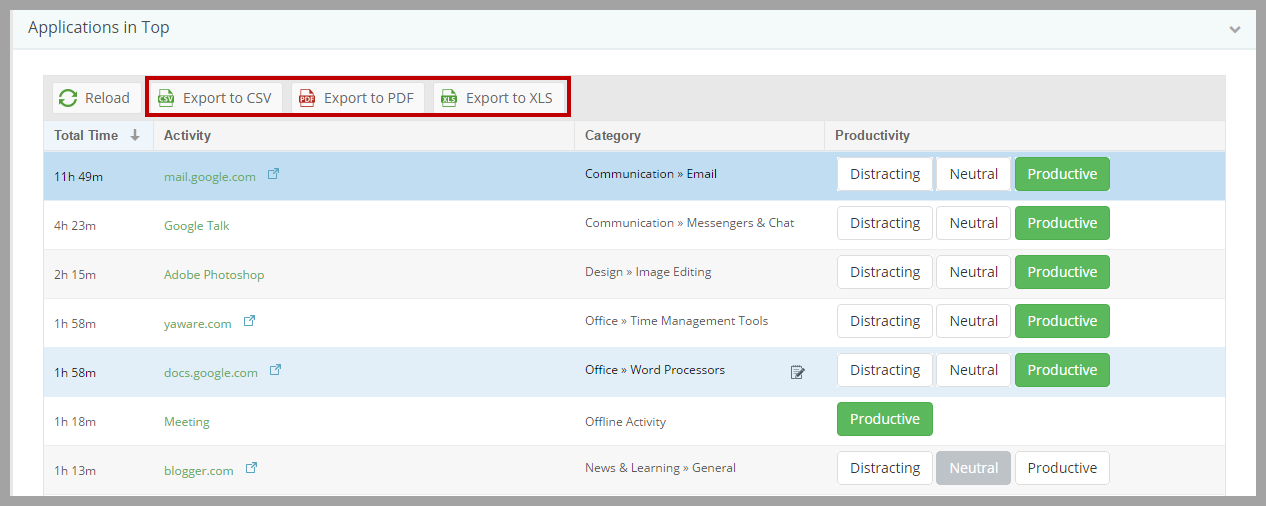
That’s it. Analyze the report, find time-eaters and eliminate them.